Network Stats
The Network Stats widget tracks all HTTP requests made by your website's visitors, giving you visibility into API performance and reliability directly from the dashboard.
How it works
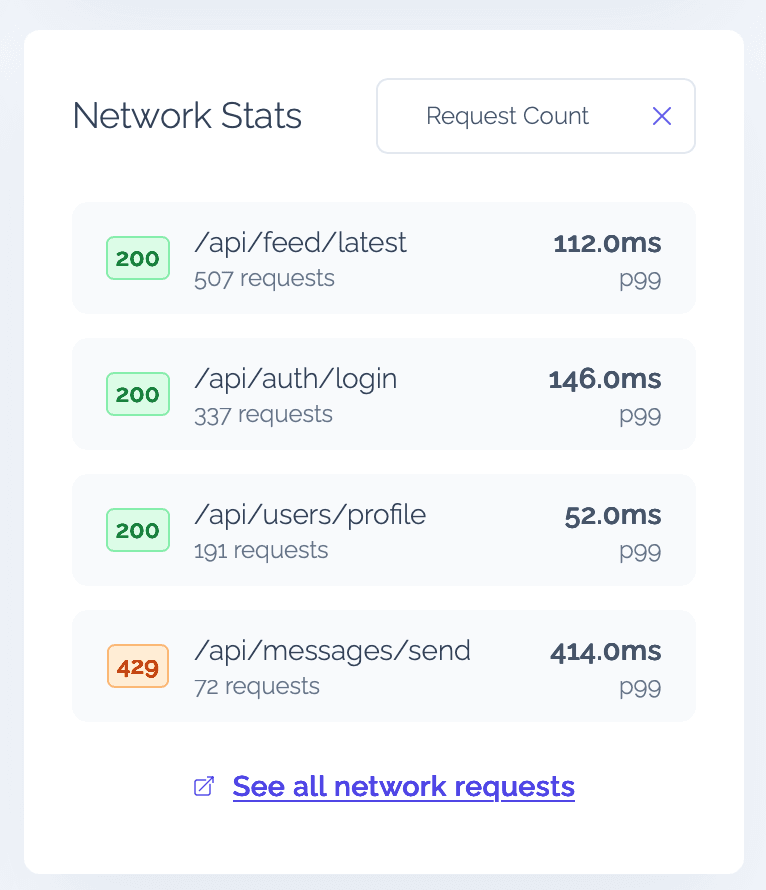
Every time a visitor's browser makes a network request, Vexo captures the route (URL), HTTP status code, request count, and latency. The widget groups these requests and displays them in a list, showing:
- Route — the API endpoint or URL path
- Status code — color-coded HTTP status
- Request count — total number of requests to that route
- Latency — response time (p99 by default)
Sorting
You can sort the network stats by different criteria using the dropdown at the top of the widget:
- Request Count (default) — most called endpoints first
- Latency — slowest endpoints first
- Status Code — grouped by HTTP status code
This makes it easy to quickly find your most-used endpoints, identify slow routes, or spot failing APIs.
Filtering
The Network Stats widget respects all global dashboard filters — date range, country, OS, and browser. Apply filters at the top of the dashboard to narrow down network performance for specific visitor segments.
For example, filter by a specific browser to check if API latency varies between Chrome and Safari, or filter by country to identify regional performance issues.