Errors
The Errors widget gives you instant visibility into the most frequent JavaScript errors happening on your website, directly on the dashboard. Instead of digging through browser developer tools or external error trackers, you can spot critical issues at a glance.
How it works
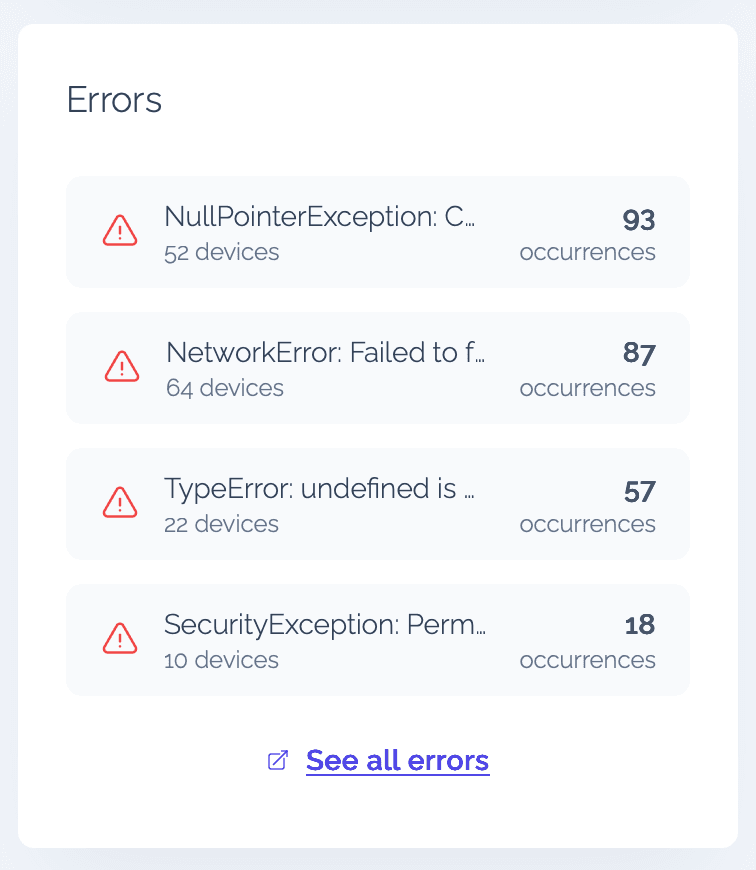
Vexo automatically captures JavaScript errors from your website and groups them by error message. Each row in the widget shows:
- Error message — the grouped error text (truncated if long)
- Device count — how many unique devices are affected
- Occurrence count — the total number of times that error has occurred
Errors are sorted by occurrence count (most frequent first), so the issues impacting the most users always appear at the top.
Viewing error details
Click on any error row to open a detail modal with more information about that specific error, including its full message and impact metrics. This lets you quickly triage issues without leaving the dashboard.
Filtering
The Errors widget respects all global dashboard filters — date range, country, OS, and browser. When you apply a filter at the top of the dashboard, the errors update to reflect only the matching segment.
For example, you can filter by a specific browser to check if errors are browser-specific, or filter by country to see if errors correlate with certain regions.