Retention
Retention measures the percentage of users who return to your app after their first session. It is widely considered the most critical metric for mobile apps — directly correlating with product-market fit, revenue sustainability, and growth efficiency.
How it works
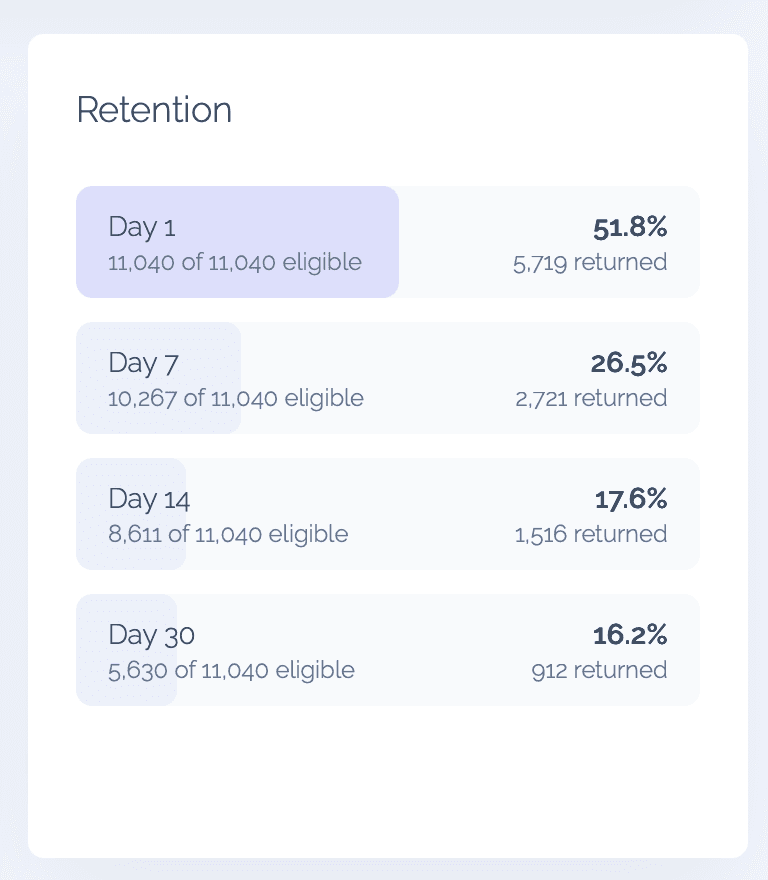
Vexo tracks when each device first opens your app (Day 0) and then checks whether that device returns on specific milestone days. The Retention widget shows four key milestones:
- Day 1 — users who returned the day after their first session
- Day 7 — users who returned one week later
- Day 14 — users who returned two weeks later
- Day 30 — users who returned one month later
Each milestone displays a horizontal bar representing the retention percentage, along with the exact rate shown inline.
Understanding the data
Cohort size
The total number of new users in the selected period, giving you context for the percentages.
Eligible users
Not all users may have had enough time to reach every milestone. For example, if a user installed your app 5 days ago, they can appear in the Day 1 calculation but not yet in Day 7.
Each bar shows "X of Y eligible" — where X is the number of users who have had enough time to reach that day, and Y is the total cohort size. When all users are eligible, the data is complete. When fewer users are eligible, the bar appears in a lighter color to indicate partial data.
If zero users are eligible for a milestone (e.g., your app is too new to have Day 30 data), that bar shows "—" instead of a percentage.
Retention model
The widget uses the Classic (N-day) retention model: a user counts as retained on Day N only if they were active on exactly that calendar day. This is the industry standard used by tools like Amplitude and Mixpanel.
Filtering
The Retention widget respects all global dashboard filters — date range, country, OS, and app version.
- Date range adjusts the cohort window — only users whose first session falls within the selected range are included
- Country, OS, and App version filters let you compare retention across user segments
For example, filter by "United States" to see if your US users retain better than global averages, or compare retention across app versions to measure the impact of product changes.